

Spreadsheet vs. Database Mapping
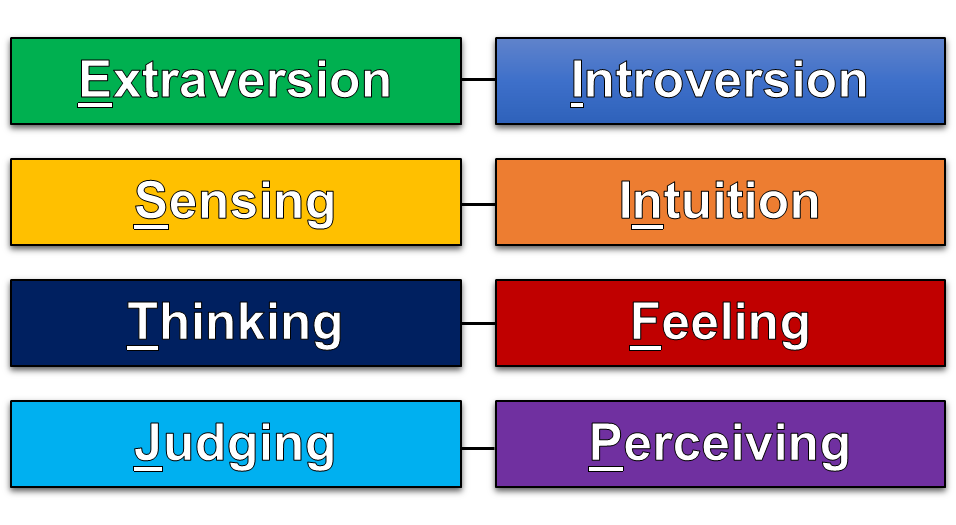
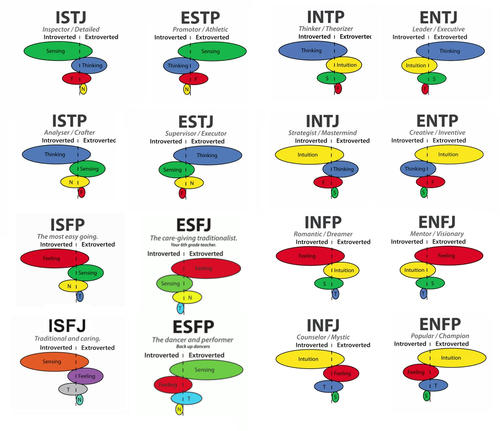
Recently, for our module 1 project, we created a database which provided different personality type analyses based on the Myers-Briggs Type Indicator. This test essentially sorts people into 16 personality types formed of 4 letters. Since each letter is encoded with a certain meaning according to the MBTI indicator, we thought it would be interesting to be able to return different data based on different combinations within the 4 letter personality type set.
For example, for type INFJ (Introverted iNtuitive Feeling Judging):
1) You could generate an analysis based on each letter.
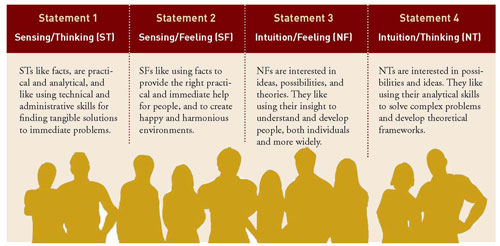
2) You could generate a certain analysis based on the combination N+F.
3) This type itself comes with an ordered set of 4 'cognitive functions', and it could return an analysis based on each.
In terms of data, this meant we already had 3 tables we needed to create to pull information from for each type.
The headers were simple to figure out for these.
1) Columns: (1) Letter, (2) Description of Each Letter
Row: 16 rows, one for each letter
2) Columns: (1) Combination, (2) Description of Each Combination
Row: 8 rows, one for each combination
3) Columns: (1) Type, (2) Dominant Function Description, (3) Auxiliary Function Description, (4) Tertiary Function Description, (5) Inferior Function Description
Row: 16 rows, one for each personality type
And the process of pulling the data from these tables was also simple - to break the 4 letters apart, match them to the first column of every table, select the relevant information from one of the columns to its right, and to return it.
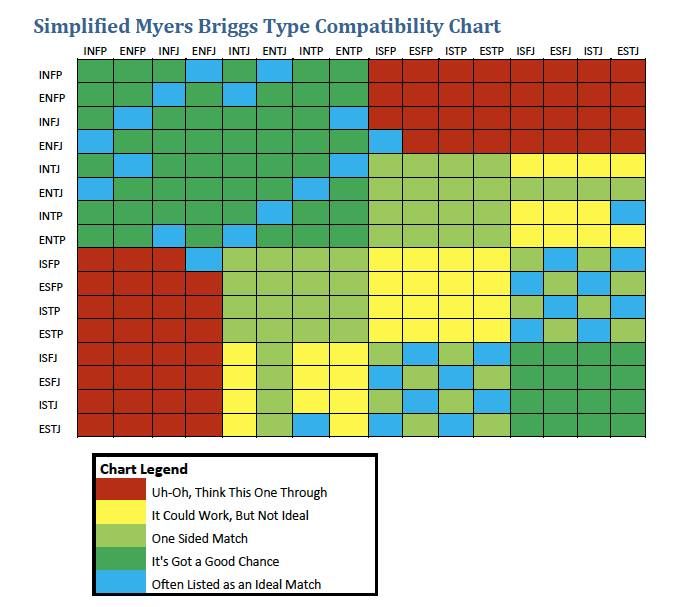
However, the big challenge in this project was mapping out what type-to-type compatibility would look like in a database. What happens when you have a complex data set that looks like this? How do you make it easy for the computer to read?
Ideas I had were:
1) A 16 x 16 chart, with the compatibility score as the entry?
But how would I access the corresponding type if it was the name of the column?
2) Group types into little arrays based on the chart legend - i.e. 5 arrays, one that could go in each column.
Although arrays aren't allowed in data tables.
3) Simply everything into three categories of 'very, potentially, and least" compatible and have the entries for each row look like long strings that I'd eventually break into arrays.
But to do a lookup through string manipulation would cause methods to get really complicated and perhaps break in certain instances.
Given issues to do with column lookup functions, and the information that I needed (both the type, and the compatibility score), what I ended up doing, was a combination of all 3.
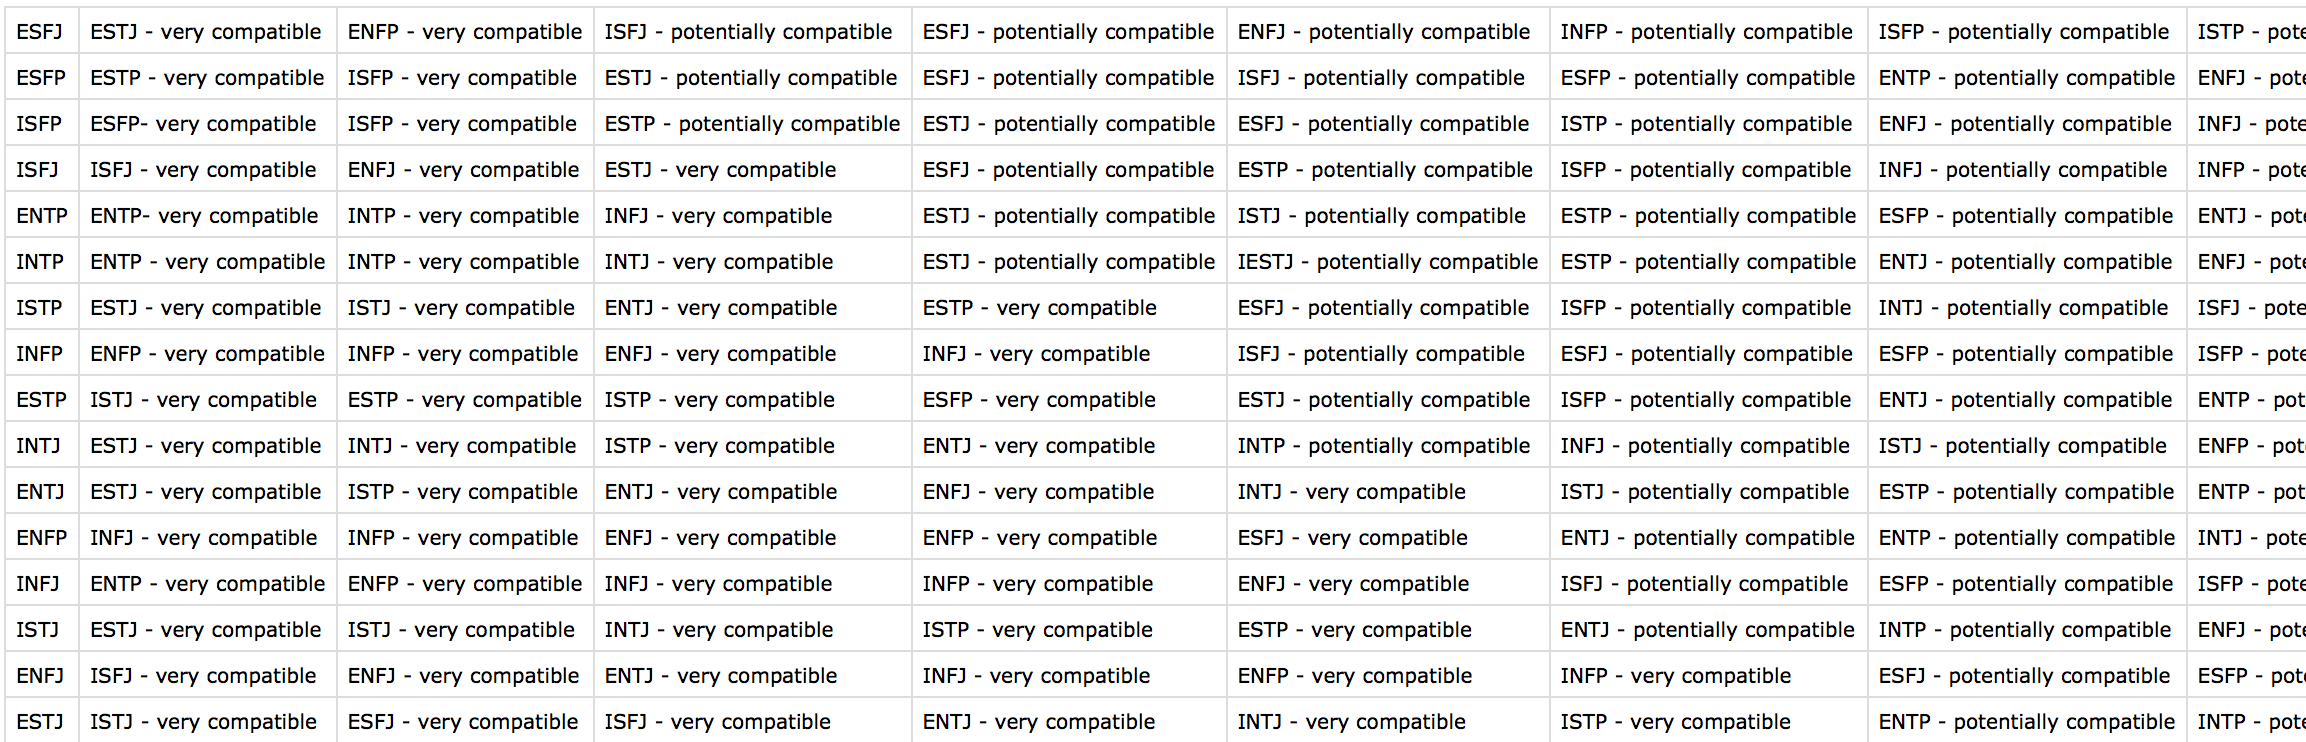
I ended up making a 16 x 16 table, where each cell had both a corresponding type and compatibility score. That way I could both access the type name and score, using string manipulation. As every cell reliably only had these two parts of information, it would be consistent across the table.
This part took me two hours of sifting through compatibility charts and formats, trying to visualise how the computer would carry out the necessary operations on the data, and figuring out what would not eventually cause my methods to have to be too complex.
Database Thinking vs. Spreadsheet Thinking
Thinking about the challenges involved in structuring a database, I decided to look into this practice within computer science. After all, with large-scale projects, I can only imagine what a pain it would be to set up a database structure that couldn't evolve or grow with added functionality.
It is often said that 80% of data analysis is spent on the process of cleaning and preparing the data (Dasu and Johnson 2003). Data preparation is not just a first step, but must be repeated many over the course of analysis as new problems come to light or new data is collected.
Tidy Data, Hadley Wickham, Journal of Statistical Software
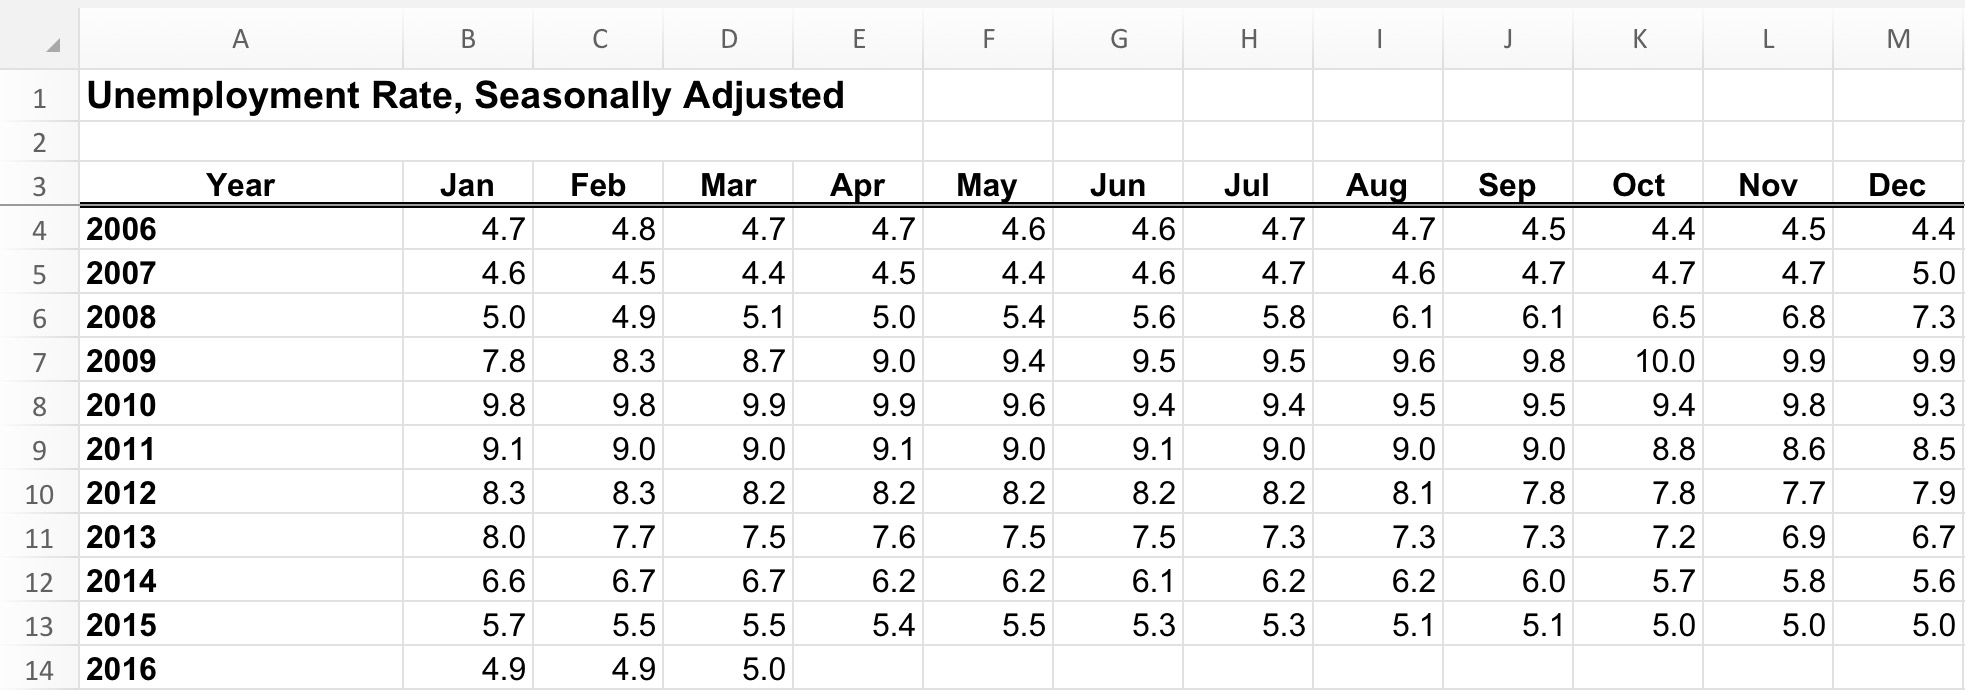
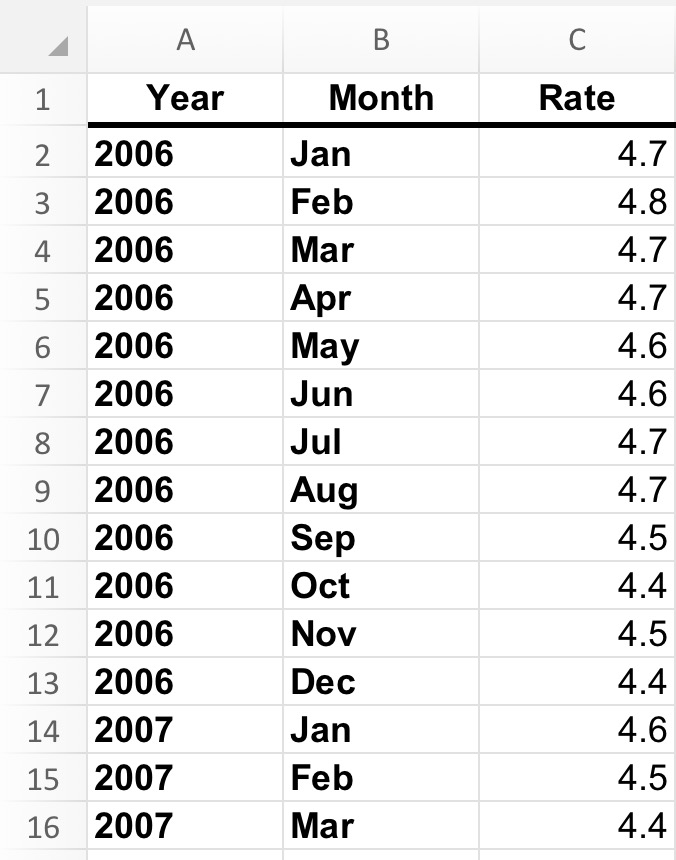
There is a common principle about the shape of datasets - that while spreadsheets for human use are often short and wide... i.e. many columns and few rows, to avoid repetition, those most easily read by the computer are long and narrow - few columns with many rows.
Consider this data set represented in two ways:
Some Tips - Tidy Data
Apparently, there is a whole framework of tips and practices surrounding database architecture, that for those of us looking to get deeper in the back-end might find helpful.
Tidy data has the following principles:
1) Each variable forms a column.
2) Each observation forms a row.
3) Each type of observational unit forms a table.
The 5 most common problems with messy datasets are the following:
1) Column headers are values, not variable names.
2) Multiple variables are stored in one column.
3) Variables are stored in both rows and columns.
4) Multiple types of observational units are stored in the same table.
5) A single observational unit is stored in multiple tables.
Analysing my own resolution to the problem above, regarding compatibility charts - I see that as much as possible I avoided storing variable names in column headers. However, in my result, I still have multiple variables stored in each column.
For the purposes of our project, it was enough to get the functionality working, but keeping in mind if I wanted to deal with a more dynamic set of data, it might be worth thinking along tidy data principles.